Author – 25 August 2022
How the COVID-19 PCR Test Works

The COVID-19, pandemic amongst other changes in our lifestyle, has introduced us to new medical terms that we are not quite familiar with, such as the term PCR (polymerase chain reaction). As you may already know, PCR is a method to detect SARS-COV-2 virus, more specifically its nucleic acid. It is the “golden standard” of SARS-2 detection, as declared by the World Health Association (WHO).
The PCR methodology
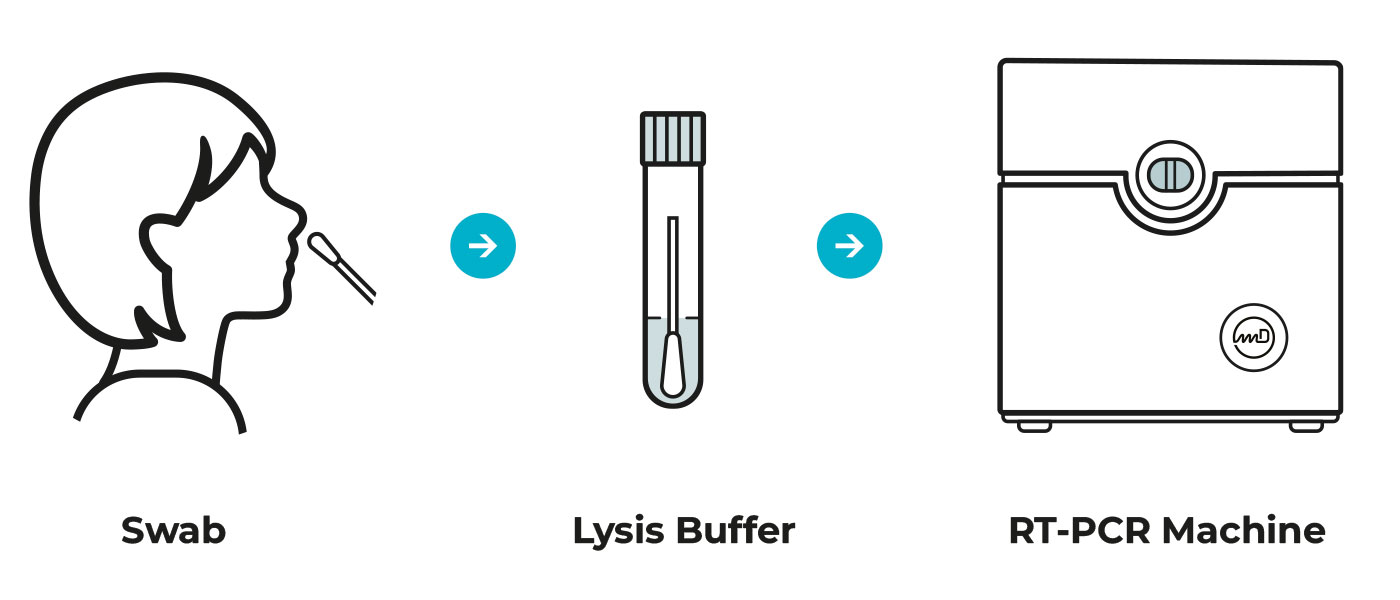
Methodology involves mixing in a closed tube the patient’s sample and the necessary building ingredients that under specific conditions can amplify a preselected portion of DNA/RNA sequence, if it is present in the patient’s sample. This procedure is repeated multiple times (PCR cycles), to make multiple fluorescent copies of the chosen viral portion, that is identical to it. This amplification is necessary, so that the system’s sensors can detect the (fluorescent) light signal emitted by these synthetic copies.
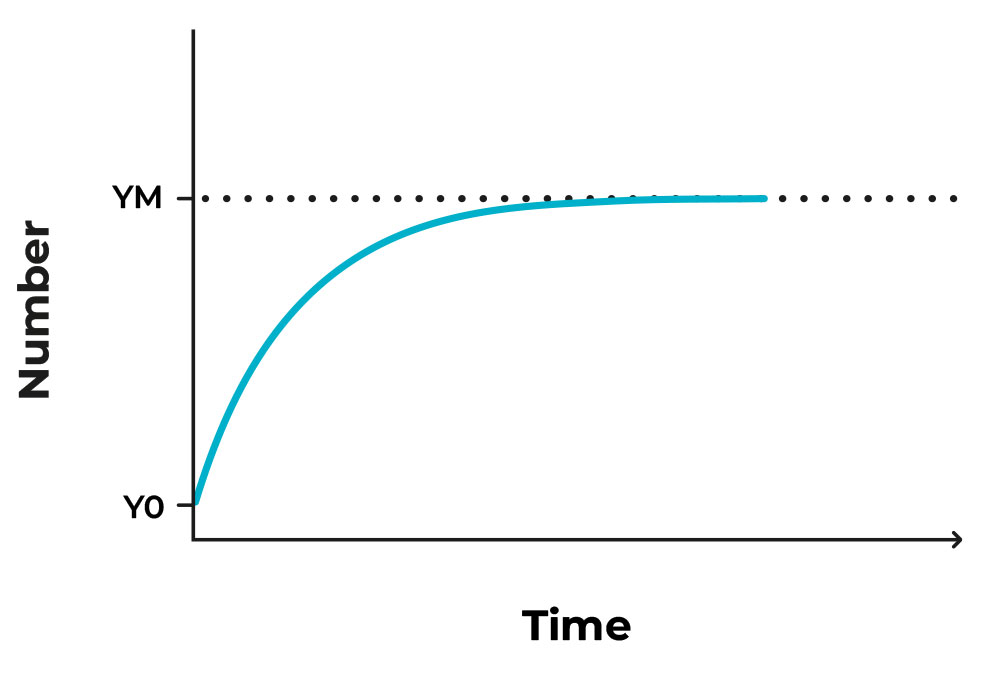
The use of products from the previous cycles as templates, renders the amplification exponential (2 copies, 4, 16, 32, etc), but reaches a plateau (flat line) when the ingredients we initially put in run out. The depleted ingredients are not a problem, as we do not wish to prolong the procedure more than necessary, and if the assay is set up correctly the point of detection is reached much sooner than material depletion. We also have to mention that known positive and negative controls are run alongside the patients’ samples, to make sure that the methodology is correct, and devoid of contamination; the known positives must be indeed positive, and the negative must remain negative, and no error has been done in any step of the procedure. This way we can trust that the results for the patients’ samples is also accurate.

Figure 1. Image of an exponential growth that reaches a plateau after some time.
PCR threshold
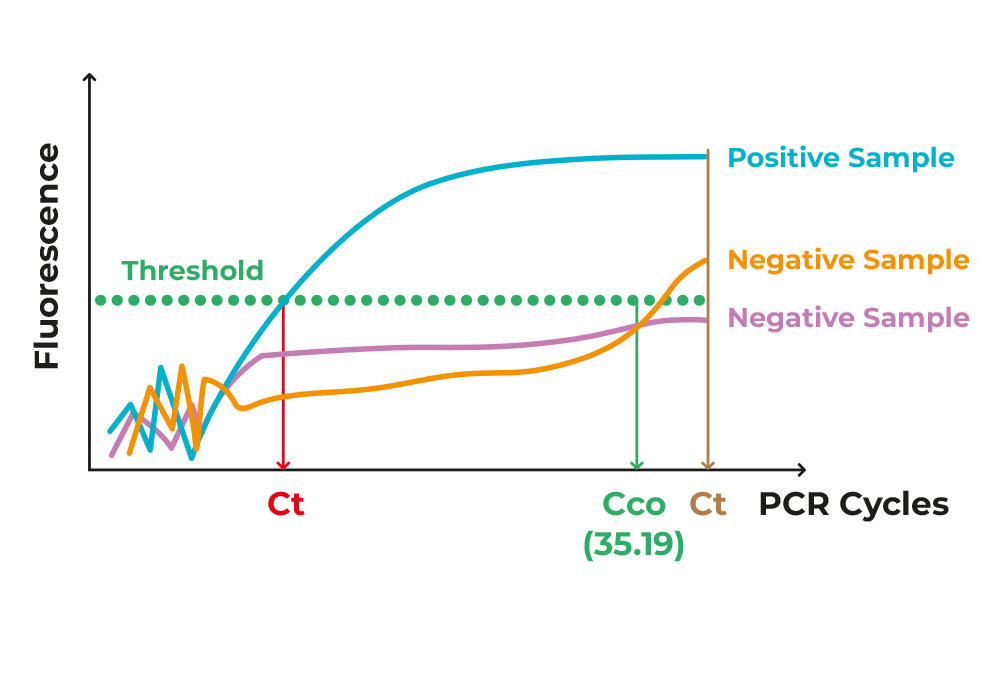
The setup of the diagnostic methodology dictates that a threshold is needed to distinguish between the positive and the negative samples. This threshold is termed Ct/Cq (threshold /quantification cycle), that is the number of cycles needed for the sample to reach the critical point of being detected and/or quantified, depending on the diagnostic setup; graphically, the cycle where the amplification curve intersects the threshold line.

Figure 2. Image of different exponential PCR curves of different samples.
As all materials are put in the testing tube from the start, and nothing gets removed from it, there is a certain amount of “noise”/background that is just “junk” or irrelevant by-product of the procedure. The true positive samples rise above that noise, in a clear-cut manner. If the number of cycles is beyond a certain cycle number, set by the methodology itself, then the samples is characterised as negative Figure 2.
As anyone can imagine, the more virus existing in the original patient’s sample (viral load), the less repeats are needed to pass the threshold. Therefore, Ct can reflect the viral presence in the patients’ collected sample, therefore how infectious those patients are to their immediate environment.
This last statement, however, needs to be taken with a grain of salt. In science nothing is black and white, and these numbers are just an indication, not a clear baseline. This is the reason why results are interpreted by trained specialists. The same sample can yield different Ct values, depending on the machine used, the handler of the samples, the reaction efficiency, the detection kit (from batch to batch) etc. Though these fluctuations are not large, they can cause concern and mistrust to the non-experienced reader of the report, especially when the sample has low viral load and is on the verge of being characterised positive or negative. In these cases, the detection can be repeated, or even better yet, have a new sample and repeat of the whole procedure, just to stay on the side of caution.
Overall, patients need to know that the lower their Ct is the more indicative the result is of heavy infection and potentially, the more infectious they are for those around them. Moreover, the detection procedures for all testing sites are highly regulated and tightly monitored in terms of result quality and accuracy.
Share this story

About miDIAGNOSTICS


